This post will delve into the Spring Boot Actuator endpoint named “httptrace.” This endpoint is used for monitoring HTTP protocol requests and responses. The Spring Boot Actuator encompasses various built-in endpoints that facilitate interaction with and monitoring of a Spring Boot application. Additionally, users have the capability to incorporate custom endpoints for interaction and monitoring purposes using the Spring Boot Actuator. The “httptrace” endpoint is an inherent feature of the Spring Boot Actuator specifically designed for monitoring HTTP request calls and responses initiated by the Spring Boot application. In the ensuing section, we’ll explore the process of configuring an HTTP trace endpoint with Spring Boot.
Enable Spring Boot Actuator
To enable the Spring Boot Actuator, you can include the necessary dependencies in the pom.xml file. The Spring Starter Project wizard is a convenient tool for adding the Spring Boot Actuator. Ensure that both the Spring Web dependencies and the Spring Boot Actuator are included. Below is an example of how to configure the pom.xml file to include the Spring Boot Starter Actuator and Spring Boot Starter Web in a Spring Boot application:
pom.xml
	<dependencies>
		<dependency>
			<groupId>org.springframework.boot</groupId>
			<artifactId>spring-boot-starter-actuator</artifactId>
		</dependency>
		<dependency>
			<groupId>org.springframework.boot</groupId>
			<artifactId>spring-boot-starter-web</artifactId>
		</dependency>
		<dependency>
			<groupId>org.springframework.boot</groupId>
			<artifactId>spring-boot-starter-test</artifactId>
			<scope>test</scope>
		</dependency>
	</dependencies>
By including these dependencies, the Spring Boot Actuator will be enabled, and you can proceed to configure the HTTP trace endpoint as needed.
Executing Spring Boot Actuator
After adding the Spring Boot Actuator in the pom.xml file, if you run the Spring Boot application, the health endpoint is enabled by default. However, the httptrace endpoint will not be exposed automatically. The Actuator endpoint display will appear as shown below:

In this case, you need to explicitly configure and expose the httptrace endpoint to monitor HTTP request calls and responses.
Customize Spring Boot Actuator httptrace endpoint
Indeed, in Spring Boot versions 2.x and later, the httptrace endpoint has been moved to a separate module, and it is not enabled by default. To enable the httptrace endpoint, you need to create a HttpTraceRepository bean in your Spring Boot application.
Below is an example Java class demonstrating how to create a HttpTraceRepository bean. The bean is configured to return an instance of the InMemoryHttpTraceRepository class:
HttpTraceActuatorConfiguration.java
package com.yawin;

import org.springframework.boot.actuate.trace.http.HttpTraceRepository;
import org.springframework.boot.actuate.trace.http.InMemoryHttpTraceRepository;
import org.springframework.context.annotation.Bean;
import org.springframework.context.annotation.Configuration;

@Configuration
public class HttpTraceActuatorConfiguration {

	@Bean
    public HttpTraceRepository httpTraceRepository() {
        return new InMemoryHttpTraceRepository();
    }

}
By creating and configuring this bean, you enable the httptrace endpoint in your Spring Boot application. The InMemoryHttpTraceRepository class, in this case, stores HTTP traces in memory. You can customize the repository based on your specific requirements, such as persisting traces to a database.
Enable Spring Boot Actuator httptrace Endpoint
To enable the Spring Boot Actuator httptrace endpoint using the application.properties file, you can include the following configurations:
application.properties
management.endpoints.web.exposure.include=health,httptrace
management.endpoint.httptrace.enabled=true
With these configurations, the httptrace endpoint will be included in the list of management endpoints, and it will be enabled for use in your Spring Boot application. Adjust these settings based on your specific requirements for managing HTTP traces.
Executing Spring Boot Actuator Endpoint with httptrace
After restarting the Spring Boot application, the Spring Boot Actuator endpoint can be accessed. By default, the application will display only the health endpoint. After adding the httptrace configuration to the application.properties file, the Spring Boot Actuator endpoint will now include the httptrace in the actuator list. The actuator list will be displayed as follows:

Now, you can access the httptrace endpoint as part of the Actuator list, allowing you to monitor HTTP traces in your Spring Boot application.
Executing Spring Boot Actuator httptrace Endpoint
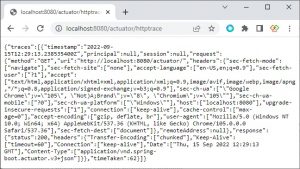
Ensure the inclusion of the httptrace endpoint in the Actuator endpoint list by following these steps. If the endpoint is not present, inspect the application code and configurations of the Spring Boot application. Restart the Spring Boot app. Upon confirming the appearance of the httptrace endpoint in the Actuator endpoint list, it becomes usable. When calling the httptrace Actuator endpoint, the resulting HTTP trace will be displayed as follows.

JSON format of httptrace endpoint
The JSON format of the httptrace endpoint is as follows, encompassing logs for both requests and responses:
{
  "traces": [
    {
      "timestamp": "2022-09-15T12:29:13.238535400Z",
      "principal": null,
      "session": null,
      "request": {
        "method": "GET",
        "uri": "http://localhost:8080/actuator/",
        "headers": {
          "sec-fetch-mode": [
            "navigate"
          ],
          "sec-fetch-site": [
            "none"
          ],
          "accept-language": [
            "en-US,en;q=0.9"
          ],
          "sec-fetch-user": [
            "?1"
          ],
          "accept": [
            "text/html,application/xhtml+xml,application/xml;q=0.9,image/avif,image/webp,image/apng,*/*;q=0.8,application/signed-exchange;v=b3;q=0.9"
          ],
          "sec-ch-ua": [
            "\"Google Chrome\";v=\"105\", \"Not)A;Brand\";v=\"8\", \"Chromium\";v=\"105\""
          ],
          "sec-ch-ua-mobile": [
            "?0"
          ],
          "sec-ch-ua-platform": [
            "\"Windows\""
          ],
          "host": [
            "localhost:8080"
          ],
          "upgrade-insecure-requests": [
            "1"
          ],
          "connection": [
            "keep-alive"
          ],
          "cache-control": [
            "max-age=0"
          ],
          "accept-encoding": [
            "gzip, deflate, br"
          ],
          "user-agent": [
            "Mozilla/5.0 (Windows NT 10.0; Win64; x64) AppleWebKit/537.36 (KHTML, like Gecko) Chrome/105.0.0.0 Safari/537.36"
          ],
          "sec-fetch-dest": [
            "document"
          ]
        },
        "remoteAddress": null
      },
      "response": {
        "status": 200,
        "headers": {
          "Transfer-Encoding": [
            "chunked"
          ],
          "Keep-Alive": [
            "timeout=60"
          ],
          "Connection": [
            "keep-alive"
          ],
          "Date": [
            "Thu, 15 Sep 2022 12:29:13 GMT"
          ],
          "Content-Type": [
            "application/vnd.spring-boot.actuator.v3+json"
          ]
        }
      },
      "timeTaken": 62
    }
  ]
}
